Where AI model spend goes for structured business tasks
Edward Xi Yang (Ertas AI)
TL;DR
In OpenRouter's 30-day classified task data, classification, extraction and transformation accounted for 20.8% of model spend. Their combined spend floor was US$12.1 million, and their per-token price indices ranged from 1.50x to 1.84x the marketplace average. These patterns identify candidate workflows for customer-specific specialists, not guaranteed savings.
Key findings
20.8%
of classified model spend
Classification contributed 10.9%, extraction 7.0% and transformation 2.9% in the 30-day snapshot fetched 12 October 2026.
US$12.1M
combined 30-day spend floor
This is a lower-bound estimate for the three categories, scaled from the top 20 models' weekly spend. It excludes spend outside that top-20 baseline.
1.50x to 1.84x
per-token price index
The index is each task's share of spend divided by its share of tokens, relative to the marketplace average. The exact values are 1.65x for classification, 1.50x for extraction and 1.84x for transformation.
75% to 87%
closed frontier share of top-10 spend
Closed frontier models accounted for 87% of the top ten models' spend in classification, 75% in extraction and 81% in transformation.
Figures and tables
Figure 1. Spend and token shares across three structured tasks
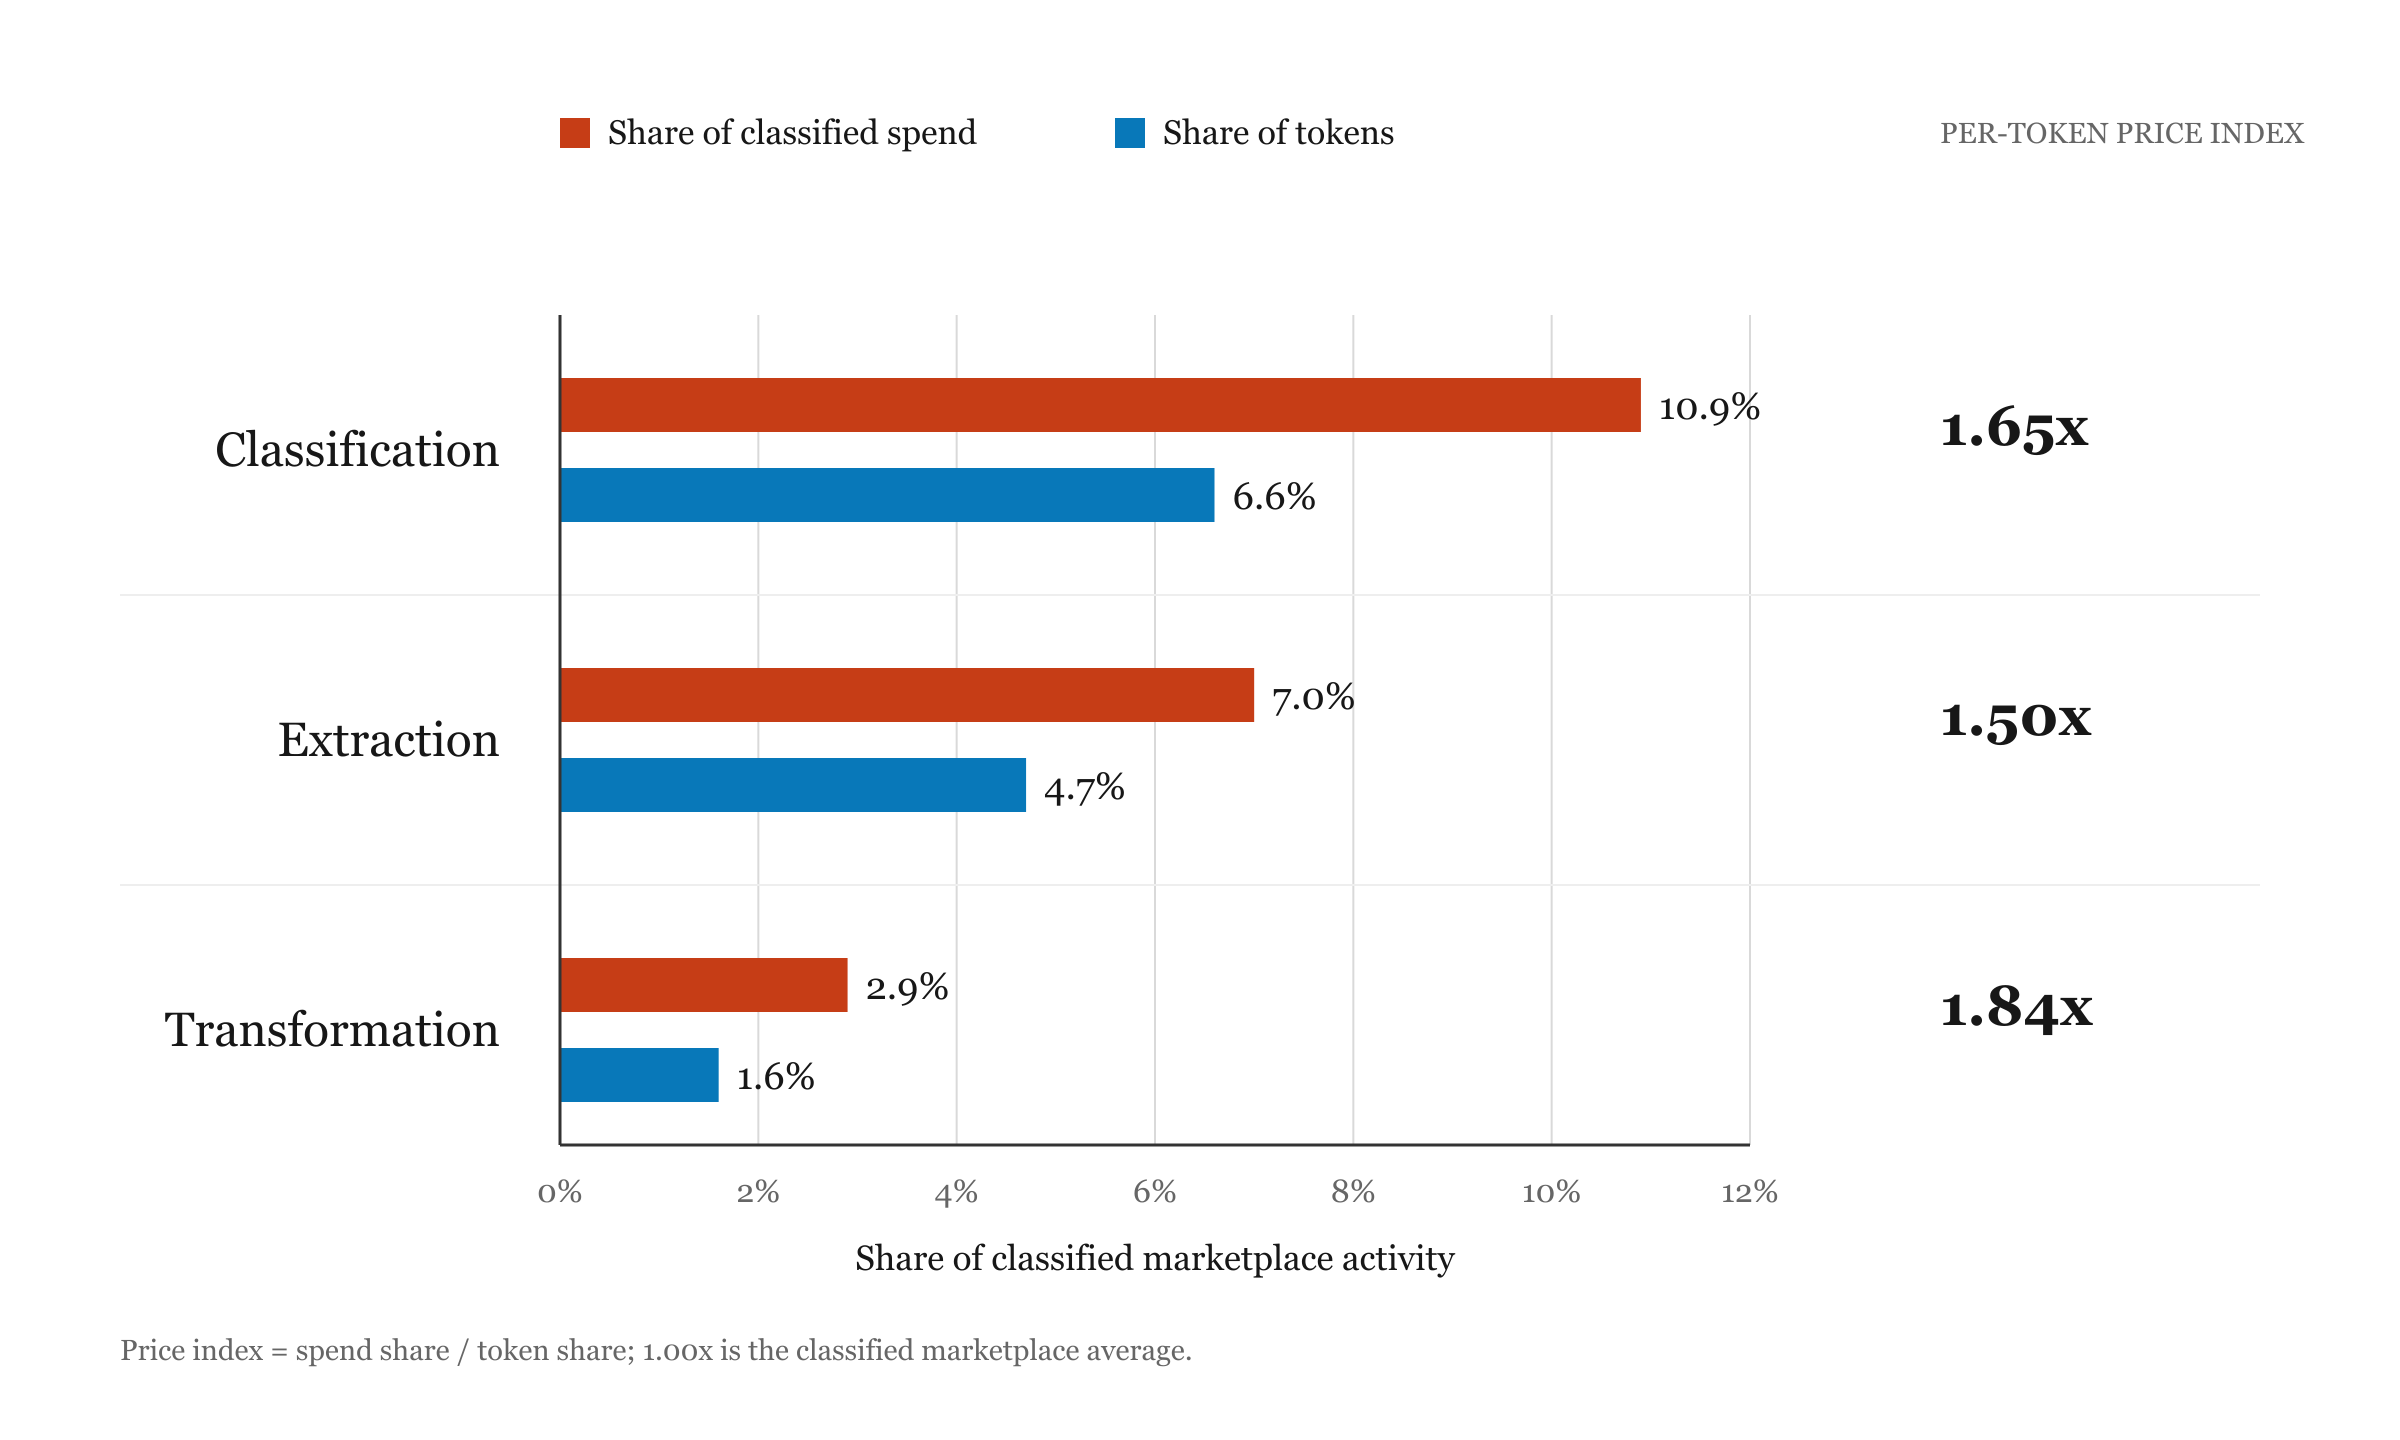
OpenRouter public task-spend and token-spend rankings, snapshot fetched 12 October 2026. Bars show each task's share of classified spend and tokens. The price index is spend share divided by token share, with the marketplace average set to 1.00x. The category dollar floors and closed frontier shares are reported in the table below. Full-size image
The three task categories in the 30-day snapshot
| Task | Share of classified spend | Spend floor | Per-token price index | Closed frontier share of top ten |
|---|---|---|---|---|
| Classification | 10.9% | US$6.3M | 1.65x | 87% |
| Extraction | 7.0% | US$4.1M | 1.50x | 75% |
| Transformation | 2.9% | US$1.7M | 1.84x | 81% |
OpenRouter classified task-spend and token-spend rankings, fetched 12 October 2026.
Spend floors are lower-bound estimates. The per-token price index is spend share divided by token share, with the marketplace average set to 1.00x.
Why it matters
These categories are worth investigating because the work repeats and the outputs are often labels or structured records that teams can check. The market data points to a place to start, not a business case by itself. A buyer still needs to measure its own task volume, current price, output quality and operating requirements.
Ertas is focusing its enterprise work on custom models built around repeatable, verifiable steps in a team's workflow. We establish a baseline with the team's examples, build for the task, then check each candidate version against the agreed quality bar before it takes on production work. The same process can show when a task is a poor fit for a specialist.
Limitations
OpenRouter labels a sample of requests across 29 task types. The task feed excludes requests in its unclassified bucket, so the percentages describe classified OpenRouter traffic rather than all AI use or all enterprise spend. The feed reports a rolling 30-day window and can change over time.
The per-token price index is aggregate spend share divided by aggregate token share. It is not a quoted provider price, a comparison against a particular buyer's contract or a measured saving from a custom model. The category dollar figures are floors, estimated by applying task shares to the top 20 models' weekly spend. Spend from models outside that top 20 is not included in the baseline.
The closed frontier share is calculated from the top ten models by spend in each task. These market-level patterns do not show that a custom model will meet a particular team's quality, security, latency or cost requirements. Those need to be assessed on the team's own data and evaluation criteria.
Abstract
We analyzed OpenRouter's public 30-day task-spend and token-spend rankings to identify repeatable business tasks where frontier models account for a high share of marketplace spend. Classification, extraction and transformation represented 20.8% of classified task spend in the snapshot. Their per-token price indices ranged from 1.50x to 1.84x the marketplace average. The findings describe sampled marketplace activity and help prioritize candidate workflows for customer-specific model evaluation. They do not establish savings for any individual buyer.
Abstract, Ertas AI analysis of OpenRouter public rankings, snapshot fetched 2026-10-12
Report, code and models
PDF
Download the research brief (PDF)A print-ready copy of this page and its chart
Also on: OpenRouter public rankings
Common questions
What does the per-token price index measure?
It divides a task's share of marketplace spend by its share of marketplace tokens. An index of 1.65x means that the task's average spend per token is 1.65 times the overall average in this classified sample.
Does the index mean every enterprise pays that price premium?
No. It is an aggregate index across OpenRouter's classified traffic. Provider choice, model mix, prompt and output lengths, negotiated pricing and caching all affect an individual team's bill.
How was the US$12.1 million figure estimated?
The three task shares were applied to a 30-day spend floor derived from the top 20 models' weekly spend. Because models outside the top 20 are omitted from that baseline, the result is a floor rather than a complete market total.
Does this research prove a custom model will reduce our costs?
No. It identifies high-spend task categories in marketplace data. A team would need to evaluate its own examples, quality bar, traffic, token use and deployment costs to establish whether a custom model is a good fit.
Cite this work
@techreport{ertas2026openroutertasks,
  title       = {Where AI Model Spend Goes for Structured Business Tasks},
  author      = {Yang, Edward Xi},
  institution = {Ertas AI},
  year        = {2026},
  month       = oct,
  url         = {https://www.ertas.ai/research/openrouter-structured-task-spend}
}
References
Ertas AI builds custom small models trained on your data, deployed on-device, in your own cloud or on Ertas-managed infrastructure. See how Ertas AI works.