Retrieved-Span Training for Efficient Query-Focused Meeting Summarization on QMSum
Edward Xi Yang (Ertas AI)
TL;DR
QMSum ships without a scorer, so we rescored 15 systems under one implementation. A 406M specialist retrained on the same retrieved transcript spans as our 1.2B system scored 36.33 ROUGE-1 against 35.41, a difference QMSum cannot statistically resolve, while using about a third of the parameters and under half the peak inference memory.
Key findings
36.33 vs 35.41
ROUGE-1 on the full QMSum test split
QMSum cannot separate the span-trained 406M specialist from our 1.2B system: the meeting-cluster 95% interval for the difference is [-0.27, +2.22], and no reported metric separates them.
2.8x
fewer total parameters, 439M against 1.2B + 33M
Both counts include the shared 33M locator. The smaller system also peaks at 2.66 GB of inference memory against 5.73 GB, and trained in about 45 minutes against 4.7 to 5.6 hours.
+5.29
ROUGE-1 from span-regime fine-tuning
Within one fixed 1.2B base model, fine-tuning on retrieved spans adds 5.29 ROUGE-1 [+4.02, +6.56]. Swapping the first 4,500 transcript words for 2,000 retrieved words adds 1.55 on test and 0.29 on validation, so most of the gain comes from the training regime.
-6.30
ROUGE-1 when a specialist's input changes
Moved from capped long input to 2,000-word retrieved spans through our inference port, a released 406M Fusion-in-Decoder specialist loses 6.30 ROUGE-1. Fine-tuning it on the span regime recovers the loss.
6.2+
ROUGE-1 lead over five hosted proprietary models
Under one concise prompt and a reference-overlap scorer, a released 406M specialist leads every proprietary hosted model tested by at least 6.2 ROUGE-1. The hosted models' verbose outputs and the absence of human or factuality evaluation limit this ordering.
Figures and tables
Figure 1. ROUGE-1 for 15 summarization systems on the QMSum test split
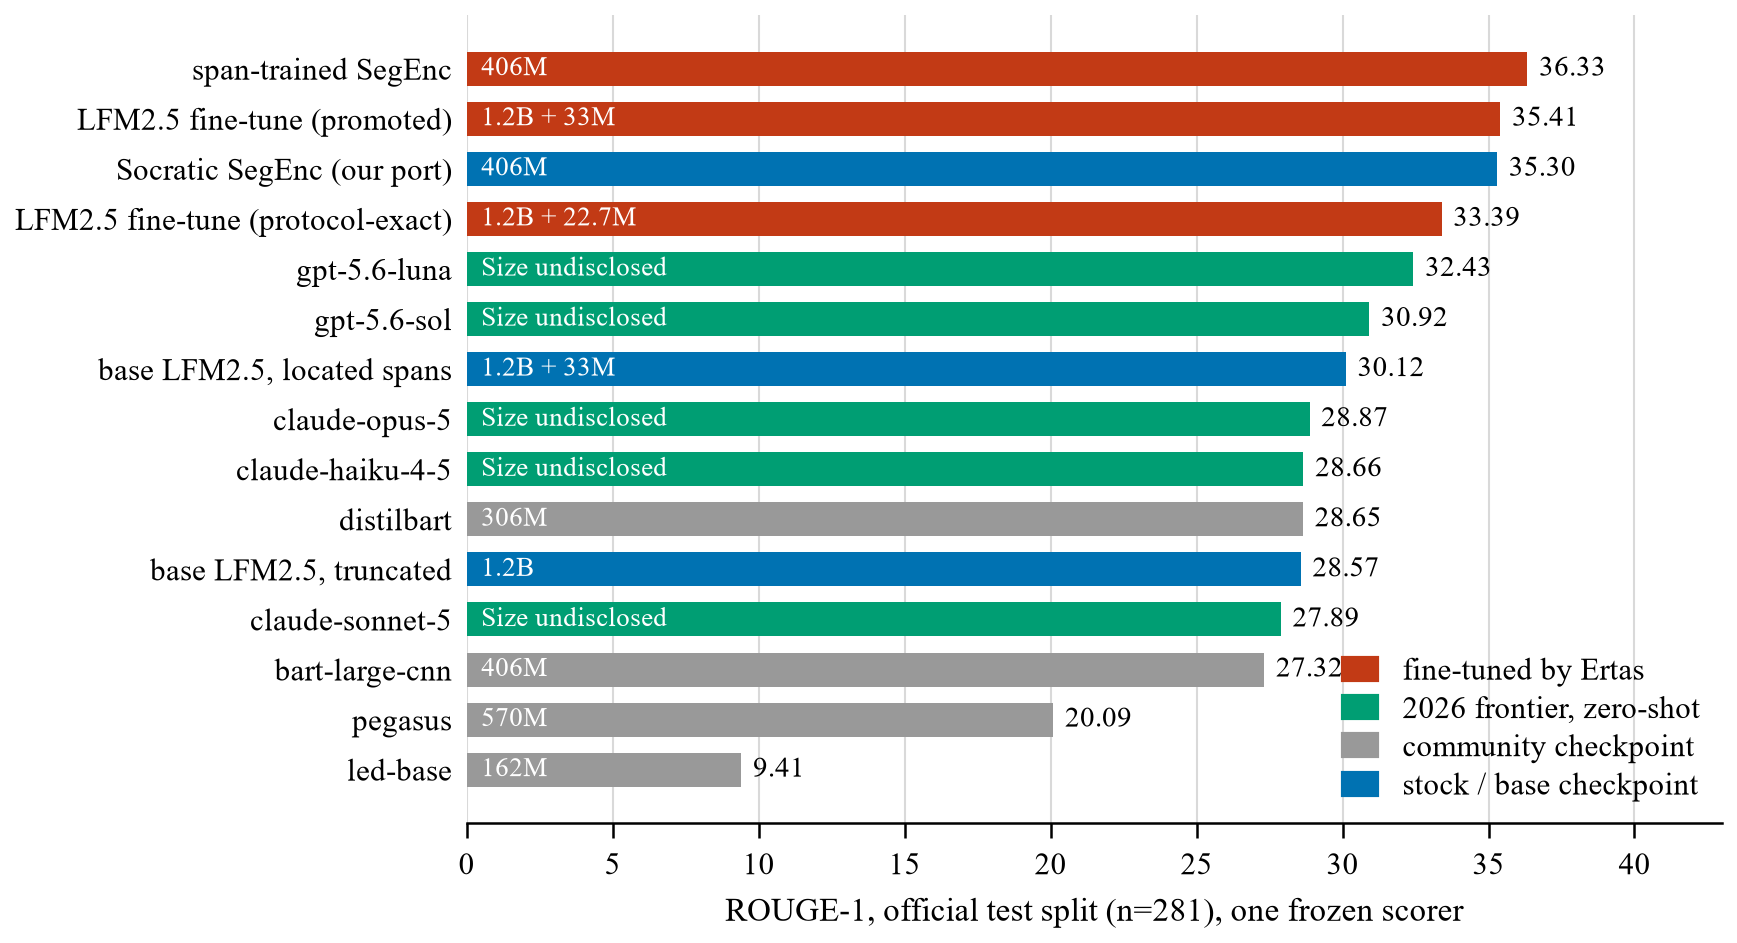
The runnable-protocol scale. Every bar uses predictions generated through our evaluation path on the official test split (n=281) and one frozen scorer. The Socratic SegEnc bar is our 35.30 port result, matching the separately labelled port row in Table 1. Systems are sorted by ROUGE-1, with parameter counts written on the bars. Hosted proprietary models ran zero-shot under one concise prompt, and their longer outputs contribute to the gap on this reference-overlap metric; no human or factuality evaluation was run. Full-size image
Figure 2. ROUGE-1 differences between the promoted 1.2B system and seven others, with 95% intervals
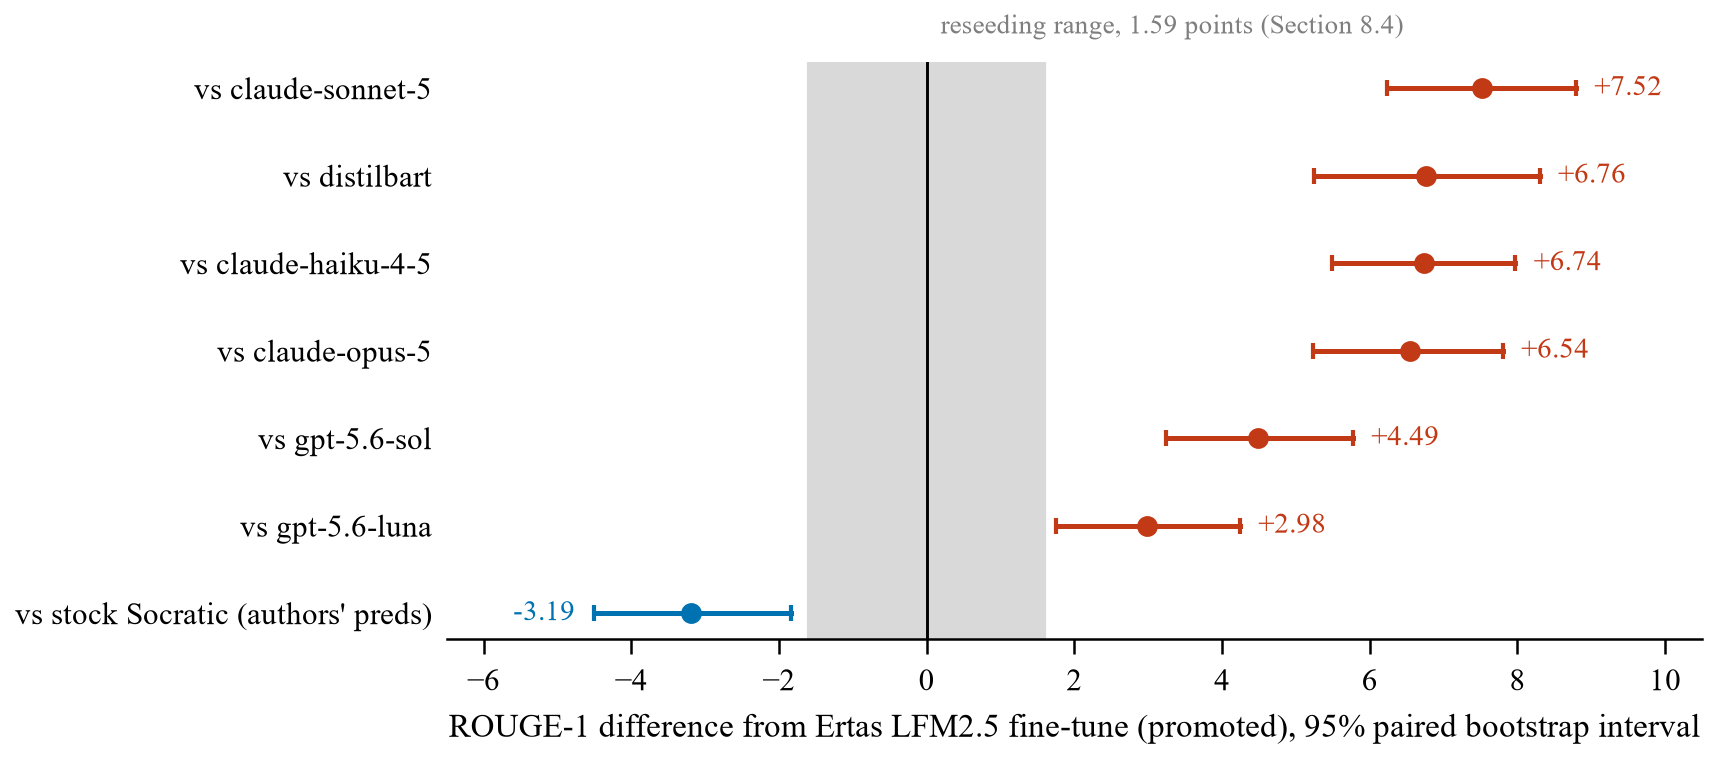
Every margin against our promoted system, with both sources of uncertainty. Bars are 95% paired bootstrap intervals over the 281 test queries, and a positive value means our system scores higher. The shaded band is the 1.59-point reseeding range, which the paired bootstrap does not capture. The hosted models' longer outputs contribute to their margins on this reference-overlap metric, and no human or factuality evaluation was run. Full-size image
Figure 3. What retrieval and fine-tuning each add within one 1.2B base model
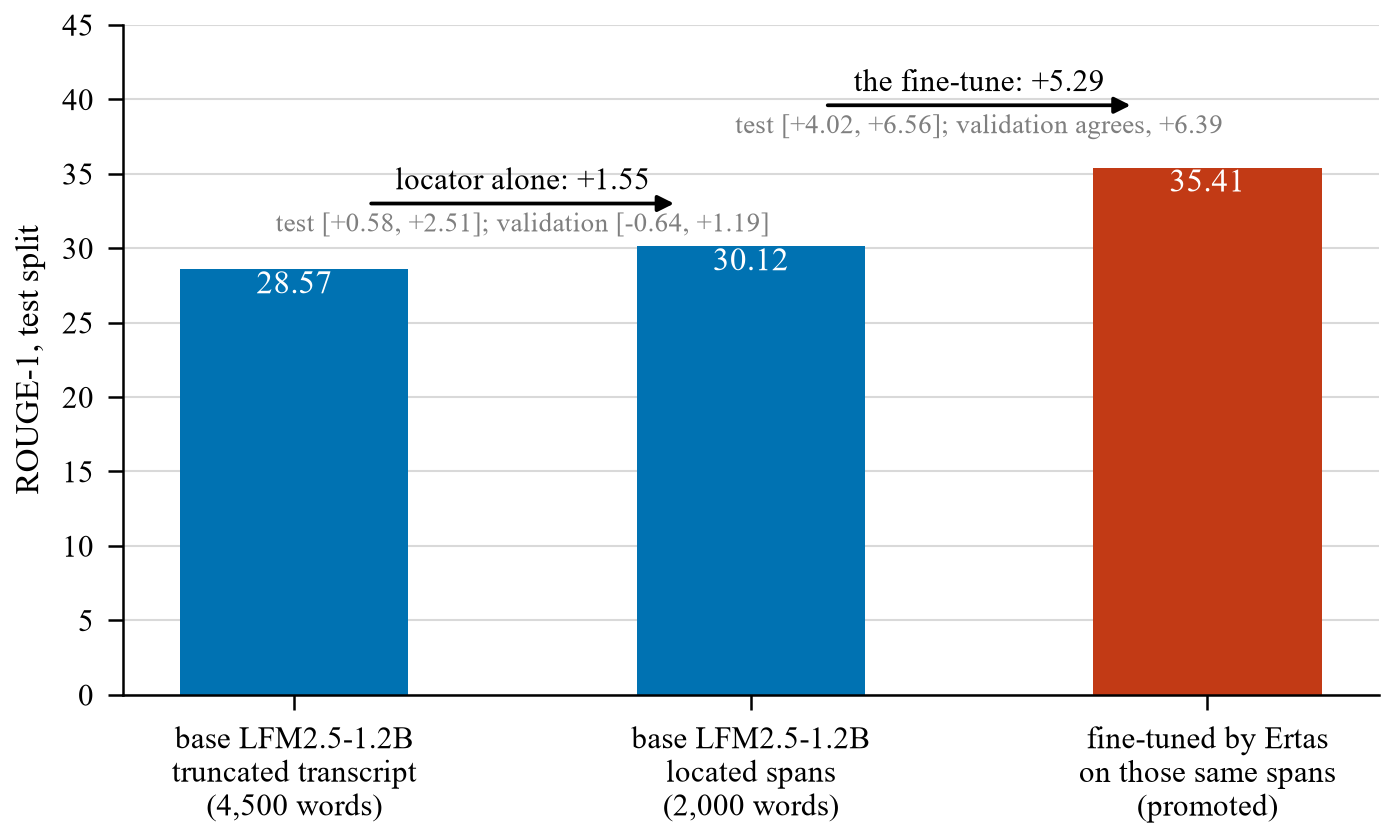
The two levers, de-confounded. One base model, one adapter, three conditions: only the input regime changes between the first two bars, and only the fine-tune between the second and third. Bracketed ranges are 95% paired bootstrap intervals. Full-size image
Table 1. Every system on every reported metric, QMSum test split
| System | Parameters | ROUGE-1 | ROUGE-2 | ROUGE-L | ROUGE-Lsum | BERTScore |
|---|---|---|---|---|---|---|
| Socratic-SegEnc (released outputs) | 406M | 38.60 | 13.91 | 24.98 | 33.71 | 0.8737 |
| Span-trained SegEnc | 406M | 36.33 | 12.72 | 23.69 | 32.17 | 0.8710 |
| Ertas LFM2.5-1.2B fine-tune (promoted) | 1.2B + 33M | 35.41 | 12.28 | 24.63 | 31.36 | 0.8733 |
| Socratic-SegEnc (our port) | 406M | 35.30 | 11.87 | 23.00 | 30.56 | 0.8695 |
| Ertas LFM2.5-1.2B fine-tune (protocol-exact) | 1.2B + 22.7M | 33.39 | 10.65 | 22.83 | 29.30 | 0.8680 |
| GPT-5.6 Luna (zero-shot) | undisclosed | 32.43 | 7.89 | 19.05 | 27.49 | 0.8608 |
| GPT-5.6 Sol (zero-shot) | undisclosed | 30.92 | 6.94 | 18.33 | 26.10 | 0.8583 |
| LFM2.5-1.2B (zero-shot, spans) | 1.2B + 33M | 30.12 | 6.70 | 19.29 | 25.04 | 0.8687 |
| Claude Opus 5 (zero-shot) | undisclosed | 28.87 | 8.43 | 16.97 | 25.01 | 0.8522 |
| Claude Haiku 4.5 (zero-shot) | undisclosed | 28.66 | 8.42 | 17.26 | 24.19 | 0.8431 |
| DistilBART | 306M | 28.65 | 6.54 | 17.92 | 25.50 | 0.8546 |
| LFM2.5-1.2B (zero-shot, truncated) | 1.2B | 28.57 | 5.55 | 17.79 | 24.55 | 0.8607 |
| Claude Sonnet 5 (zero-shot) | undisclosed | 27.89 | 7.53 | 16.11 | 23.98 | 0.8478 |
| BART-large-CNN | 406M | 27.32 | 5.65 | 17.41 | 24.08 | 0.8513 |
| PEGASUS | 570M | 20.09 | 4.45 | 14.92 | 17.23 | 0.8344 |
| LED-base | 162M | 9.41 | 2.37 | 7.95 | 7.96 | 0.7818 |
The single-protocol scale. Full official test split (n=281), one frozen scorer, at most one test touch per system. Every row generated and scored by us, except Socratic-SegEnc (released outputs), scored from the authors' predictions.
Socratic-SegEnc appears as the authors' released outputs and as our inference port; the port is a calibration, not a reproduction. Hosted zero-shot rows use the full transcript, and their longer outputs contribute to the gap on these reference-overlap metrics. All BERTScores use the same scorer. Parameter counts are measured with num_parameters(); the community checkpoints were fine-tuned by mikeadimech. Highlighted rows are systems trained for this paper.
The span-trained 406M specialist against the promoted 1.2B system, test split
| Metric | Ertas LFM2.5-1.2B (promoted) | Span-trained SegEnc (406M) | Difference | 95% interval |
|---|---|---|---|---|
| ROUGE-1 | 35.41 | 36.33 | +0.93 | [-0.42, +2.24] |
| ROUGE-2 | 12.28 | 12.72 | +0.43 | [-0.77, +1.64] |
| ROUGE-L | 24.63 | 23.69 | -0.94 | [-2.06, +0.18] |
| ROUGE-Lsum | 31.36 | 32.17 | +0.81 | [-0.47, +2.05] |
| BERTScore | 0.8733 | 0.8710 | -0.0022 | [-0.0046, +0.0001] |
The span-trained checkpoint was fixed on validation and taken to the test split once. Differences are span-trained SegEnc minus Ertas LFM2.5-1.2B, with 95% paired bootstrap intervals over 281 queries. Every interval crosses zero, and the meeting-cluster ROUGE-1 interval is [-0.27, +2.22].
The paper prints this table without a number, in Section 7.5.
Table 2. Resource use of the 406M and 1.2B systems at an unresolved test difference
| Measure | Span-trained SegEnc | Ertas LFM2.5-1.2B (promoted) | Ratio |
|---|---|---|---|
| Parameters, including the shared 33M locator | 439M | 1.2B + 33M | 2.8x |
| Peak inference VRAM, max over the validation split | 2.66 GB | 5.73 GB | 2.16x |
| Peak inference VRAM, median | 2.66 GB | 4.71 GB | 1.77x |
| Mean latency per query, two validation runs each, locate step included | 1.85s and 2.00s | 2.35s and 2.76s | 1.3x to 1.4x |
| Training to this checkpoint | About 45 minutes (eight matched-chunk epochs; the first four measured at 22 minutes) | 4.7 to 5.6 hours | Large |
| Test ROUGE-1 | 36.33 | 35.41 | Difference unresolved |
Resource comparison at an unresolved test difference. Both systems include the shared locator; ratios divide our measured value by the span-trained SegEnc value. Crossing intervals do not establish formal equivalence.
Measured on one NVIDIA RTX 5070 Ti (16 GB). Memory is the summarizer's peak allocated memory over the full validation split.
Why it matters
The largest lever this study isolated was training the summarizer on the same retrieved-span inputs it reads at inference, worth 5.29 ROUGE-1 within one base model. A 406M specialist trained that way scored within QMSum's resolution of our 1.2B system while needing under half the peak inference memory.
For summarization run at volume, that footprint sets serving cost, so a smaller specialist is worth measuring before choosing a larger model.
Limitations
All conclusions are limited to QMSum and automatic metrics (ROUGE and BERTScore); no human or factuality evaluation was run. The 406M and 1.2B systems are not separated on any reported metric, and crossing intervals do not establish formal equivalence.
The strongest released specialist's full-input row is scored from its authors' released predictions, our port of that system is not a reproduction, and training cost was measured on one machine at the edge of its memory.
Abstract
QMSum provides no scorer, making query-focused meeting summarization results difficult to compare. We rescore or generate 15 systems under one implementation. Through a common inference port, a released 406M Fusion-in-Decoder specialist loses 6.30 ROUGE-1 when moved from capped long input to 2,000-word retrieved spans. Fine-tuning it on this span regime recovers the loss. On test it scores 36.33 ROUGE-1 versus 35.41 for our 1.2B system; the meeting-cluster 95% interval for the difference is [-0.27, +2.22], so QMSum does not statistically separate them. The smaller system uses about one-third as many total parameters and less than half the peak inference memory. Within the fixed 1.2B base, span-regime fine-tuning adds 5.29 [+4.02, +6.56], while replacing the first 4,500 transcript words with 2,000 retrieved words adds 1.55 on test and 0.29 on validation. Separately, under one concise prompt and reference-overlap scorer, a released 406M specialist exceeds five proprietary hosted models by at least 6.2 ROUGE-1, but output length and absent human or factuality evaluation limit this ordering. Conclusions are limited to QMSum and automatic metrics.
Abstract, arXiv:2609.25028v1
Paper, code and models
arXiv
arXiv:2609.25028The paper, 24 pages
GitHub
ErtasAI/qmsum-retrieved-span-trainingCode, data build and evaluation scripts
Hugging Face model
ErtasAI/qmsum-summarizer-lfm2.5-1.2b-loraLoRA adapter for LFM2.5-1.2B, the 1.2B summarizer
Hugging Face model
ErtasAI/qmsum-summarizer-segenc-406m-spans406M Fusion-in-Decoder summarizer retrained on retrieved spans
Hugging Face model
ErtasAI/qmsum-locator-minilm-l12-w375Cross-encoder locator over 375-word windows, the promoted configuration
Hugging Face model
ErtasAI/qmsum-locator-minilm-l6-w900Cross-encoder locator over 900-word windows, the protocol-exact configuration
Also on: Hugging Face paper page · DOI 10.48550/arXiv.2609.25028
Common questions
What is retrieved-span training?
Retrieved-span training fine-tunes a summarizer on the inputs it will see at inference. For each query, a retrieval step scores fixed-width transcript windows and packs the highest-scoring ones, up to 2,000 words, and the model learns to summarize from those spans instead of from the transcript's opening words.
Is the 406M model as good as the 1.2B model on QMSum?
On the QMSum test split the 406M model scored 36.33 ROUGE-1 and the 1.2B system 35.41, and the benchmark cannot statistically separate them: the meeting-cluster 95% interval for the difference is [-0.27, +2.22]. Crossing intervals do not establish formal equivalence, so the paper reports the difference as unresolved.
How does a released 406M specialist compare with hosted proprietary models on QMSum?
Under one concise prompt and a reference-overlap scorer, a released 406M specialist scored at least 6.2 ROUGE-1 above each of the five proprietary hosted models tested. The paper limits that ordering: the hosted models produced verbose outputs, and no human or factuality evaluation was run.
Why does QMSum need a common scorer?
QMSum was released without an official scorer, so each paper generates and scores its own results with different ROUGE packages and generation protocols. The paper rescores or generates 15 systems under one implementation and one frozen protocol on the full 281-query test split.
Is this state of the art on QMSum?
No. The strongest published systems, which do not split the transcript into retrieved spans, report higher scores in their own papers, up to 38.82 ROUGE-1, and under our scorer our 1.2B system sits 3.2 ROUGE-1 below the strongest released specialist. The contribution is a common scoring protocol and a cost result, not a new top score.
Are the code and models available?
Yes. The code, data build and evaluation scripts are on GitHub, and the four trained components, two summarizers and two retrieval locators, are on Hugging Face under the ErtasAI account.
Cite this work
@misc{yang2026retrievedspan,
  title         = {Retrieved-Span Training for Efficient Query-Focused Meeting Summarization on {QMSum}},
  author        = {Yang, Edward Xi},
  year          = {2026},
  eprint        = {2609.25028},
  archivePrefix = {arXiv},
  primaryClass  = {cs.CL},
  doi           = {10.48550/arXiv.2609.25028},
  url           = {https://arxiv.org/abs/2609.25028}
}
References
- Zhong et al. (2021), QMSum: A New Benchmark for Query-based Multi-domain Meeting Summarization, NAACL
- Vig et al. (2022), Exploring Neural Models for Query-Focused Summarization, Findings of NAACL
- Pagnoni et al. (2023), Socratic Pretraining: Question-Driven Pretraining for Controllable Summarization, ACL
- Sotudeh and Goharian (2024), Learning to Rank Salient Content for Query-focused Summarization, EMNLP
Ertas AI builds custom small models trained on your data, deployed on-device, in your own cloud or on Ertas-managed infrastructure. See how Ertas AI works.